

Los Angeles Kings
Western Pacific
6-11-2Record
10-9ATS
8-11O/U
Los Angeles Kings team stats
Where the Los Angeles Kings rank across offense and defense.
Offense
Goals per game2.726thof 32Bottom third
Shots per game27.812thof 32
GF5230th of 32
SOG52927th of 32
SH%9.827th of 32
A8631st of 32
PPO63
Defense
Goals allowed per game3.318thof 32
Shots allowed per game27.516thof 32
GA6312th of 32
SA5233rd of 32
BLK284
TK8221st of 32
HIT453
Defense vs position
1st = the easiest matchup in the league, not the best defense.
| Position | TougherEasier | Rank |
|---|---|---|
| vs C | 5th of 32 | |
| vs LW | 16th of 32 | |
| vs RW | 18th of 32 | |
| vs D | 15th of 32 |
Los Angeles Kings leaders
Each player opens in the Prop Bet Analyzer.
Scoring
 10Artemi PanarinLW
8G
11A
19PTS
| Player | G | A | PTS |
|---|---|---|---|
| Brandt Clarke D | 3 | 11 | 14 |
| Adrian Kempe RW | 6 | 7 | 13 |
| Alex Laferriere RW | 3 | 10 | 13 |
| Drew Doughty D | 1 | 7 | 8 |
Shooting
 14Alex LaferriereRW
57SOG
3.0SOG/G
3G
| Player | SOG | SOG/G | G |
|---|---|---|---|
| Artemi Panarin LW | 56 | 3.3 | 8 |
| Adrian Kempe RW | 56 | 3.1 | 6 |
| Quinton Byfield RW | 45 | 2.6 | 5 |
| Trevor Moore LW | 38 | 2.0 | 3 |
Physical
14Alex LaferriereRW62HIT
14BLK
3TK
| Player | HIT | BLK | TK |
|---|---|---|---|
| Scott Laughton C | 50 | 14 | 7 |
| Erik Haula LW | 39 | 14 | 5 |
| Joel Armia RW | 38 | 12 | 4 |
| Andre Lee LW | 35 | 7 | 2 |
Faceoffs
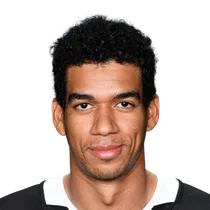 55Quinton ByfieldRW
164FOW
298FO
55.0FO%
| Player | FOW | FO | FO% |
|---|---|---|---|
| Scott Laughton C | 115 | 201 | 57.2 |
| Erik Haula LW | 111 | 229 | 48.5 |
| Alex Laferriere RW | 74 | 157 | 47.1 |
| Adrian Kempe RW | 23 | 57 | 40.4 |
Goaltending
 35Darcy KuemperG
283SV
88.4SV%
3.3GAA
| Player | SV | SV% | GAA |
|---|---|---|---|
| Anton Forsberg G | 177 | 90.8 | 2.4 |