

San Jose Sharks
Western Pacific
10-12-2Record
11-13ATS
11-13O/U
San Jose Sharks team stats
Where the San Jose Sharks rank across offense and defense.
Offense
Goals per game2.627thof 32Bottom third
Shots per game27.514thof 32
GF6221st of 32
SOG6606th of 32
SH%9.429th of 32
A10818th of 32
PPO91
Defense
Goals allowed per game3.522ndof 32Bottom third
Shots allowed per game30.630thof 32Bottom third
GA8429th of 32
SA73532nd of 32
BLK325
TK1091st of 32
HIT583
Defense vs position
1st = the easiest matchup in the league, not the best defense.
| Position | TougherEasier | Rank |
|---|---|---|
| vs C | 10th of 32 | |
| vs LW | 7th of 32 | |
| vs RW | 11th of 32 | |
| vs D | 12th of 32 |
San Jose Sharks leaders
Each player opens in the Prop Bet Analyzer.
Scoring
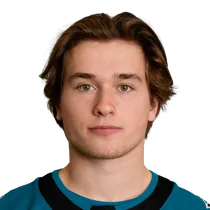 71Macklin CelebriniC
9G
18A
27PTS
| Player | G | A | PTS |
|---|---|---|---|
| Will Smith C | 8 | 11 | 19 |
| Tyler Toffoli C | 6 | 8 | 14 |
| Dmitry Orlov D | 3 | 11 | 14 |
| Ivar Stenberg LW | 7 | 7 | 14 |
Shooting
71Macklin CelebriniC93SOG
4.2SOG/G
9G
| Player | SOG | SOG/G | G |
|---|---|---|---|
| Will Smith C | 59 | 2.5 | 8 |
| Tyler Toffoli C | 49 | 2.0 | 6 |
| Mason Marchment LW | 44 | 1.8 | 6 |
| Kiefer Sherwood LW | 40 | 1.7 | 2 |
Physical
 44Kiefer SherwoodLW
115HIT
8BLK
5TK
| Player | HIT | BLK | TK |
|---|---|---|---|
| Barclay Goodrow C | 58 | 18 | 5 |
| Zack Ostapchuk C | 53 | 13 | 2 |
| Ty Dellandrea C | 47 | 12 | 1 |
| Darnell Nurse D | 43 | 38 | 5 |
Faceoffs
71Macklin CelebriniC196FOW
412FO
47.6FO%
| Player | FOW | FO | FO% |
|---|---|---|---|
| Michael Misa C | 112 | 247 | 45.3 |
| Alexander Wennberg C | 93 | 205 | 45.4 |
| Zack Ostapchuk C | 89 | 171 | 52.0 |
| Ty Dellandrea C | 75 | 142 | 52.8 |
Goaltending
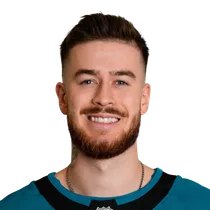 30Yaroslav AskarovG
422SV
88.8SV%
3.3GAA
| Player | SV | SV% | GAA |
|---|---|---|---|
| Alex Nedeljkovic G | 229 | 90.2 | 3.1 |